Functions and their graphs chapter 1 embarks on a mathematical journey, unraveling the intricate relationship between functions and their visual representations. This chapter lays the foundation for understanding the language of functions, empowering readers to decode and analyze real-world phenomena.
Delving into the realm of functions, we explore their essential components—domain and range—and uncover the diverse types of functions that populate the mathematical landscape, including linear, quadratic, exponential, and logarithmic functions. We delve into the art of graphing functions, mastering the steps involved in transforming algebraic equations into visual representations.
Intercepts and asymptotes become our guides, illuminating the key features that shape the graph of a function.
Functions and Their Graphs
A function is a relation that assigns to each element of a set a unique element of another set. The set of all possible inputs is called the domain of the function, and the set of all possible outputs is called the range of the function.
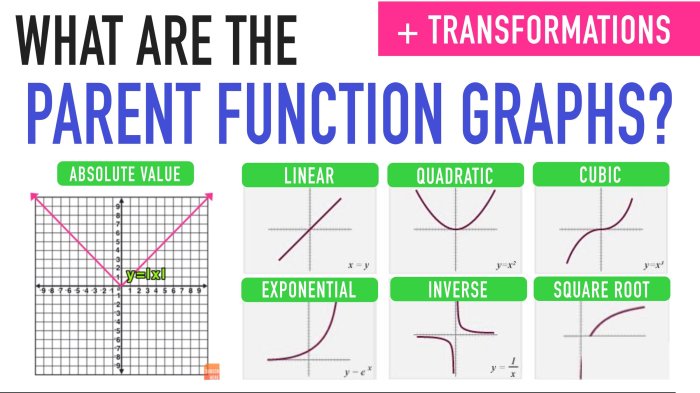
Functions can be classified into different types based on their properties. Some of the most common types of functions include linear functions, quadratic functions, exponential functions, and logarithmic functions.
Linear Functions
Linear functions are functions whose graphs are straight lines. The equation of a linear function is of the form y = mx + b, where m is the slope of the line and b is the y-intercept.
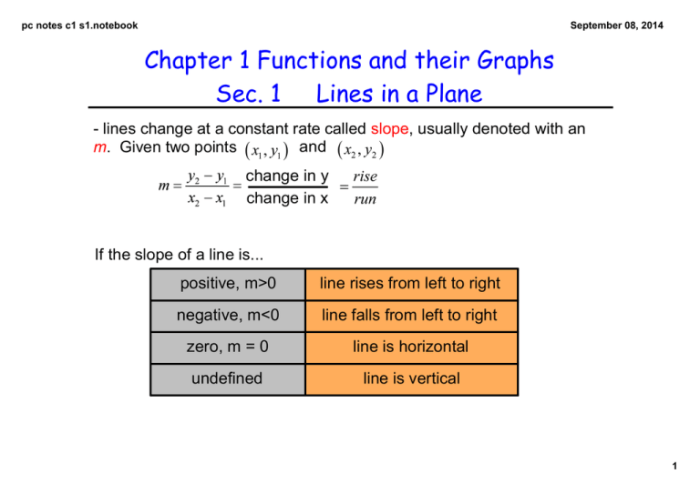
- Linear functions have a constant rate of change, which is equal to the slope of the line.
- Linear functions can be increasing or decreasing, depending on the sign of the slope.
Quadratic Functions
Quadratic functions are functions whose graphs are parabolas. The equation of a quadratic function is of the form y = ax^2 + bx + c, where a, b, and c are constants.
- Quadratic functions have a maximum or minimum value, which occurs at the vertex of the parabola.
- Quadratic functions can be opening up or opening down, depending on the sign of the coefficient a.
Exponential Functions
Exponential functions are functions whose graphs are exponential curves. The equation of an exponential function is of the form y = a^x, where a is a constant.
- Exponential functions are always increasing or decreasing, depending on the sign of the base a.
- Exponential functions have a horizontal asymptote, which is the value that the function approaches as x goes to infinity.
Logarithmic Functions
Logarithmic functions are functions whose graphs are logarithmic curves. The equation of a logarithmic function is of the form y = log ax, where a is a constant.
- Logarithmic functions are always increasing or decreasing, depending on the sign of the base a.
- Logarithmic functions have a vertical asymptote, which is the value that the function approaches as x goes to zero.
Graphing Functions

Graphing functions is a fundamental skill in mathematics. It allows us to visualize the relationship between the input and output values of a function and to understand its behavior. There are several steps involved in graphing a function:
Determining the Domain and Range
The domain of a function is the set of all possible input values, while the range is the set of all possible output values. Determining the domain and range helps us establish the boundaries of the graph.
Finding Intercepts
The intercepts of a function are the points where the graph crosses the x-axis (x-intercepts) and the y-axis (y-intercepts). Finding the intercepts provides key reference points for the graph.
Determining Asymptotes
Asymptotes are lines that the graph approaches but never touches. Vertical asymptotes occur when the function is undefined, while horizontal asymptotes occur when the function approaches a constant value as the input approaches infinity or negative infinity.
Plotting Points
By choosing a few input values within the domain, we can calculate the corresponding output values and plot the points on the graph. Connecting these points with a smooth curve or line gives us the graph of the function.
Using Technology
Graphing calculators and online graphing tools can be valuable aids for graphing functions. These tools allow us to quickly and accurately plot graphs, explore different functions, and visualize complex relationships.
Transformations of Functions: Functions And Their Graphs Chapter 1

Transformations of functions are operations that alter the graph of a function without changing its fundamental shape. These transformations include translations, reflections, dilations, and combinations thereof. Understanding transformations is crucial for analyzing and manipulating functions.
Translations
Translations shift the graph of a function horizontally or vertically. Horizontal translations, also known as shifts along the x-axis, are represented by adding or subtracting a constant from the input variable. Vertical translations, or shifts along the y-axis, involve adding or subtracting a constant from the output variable.For
example, translating the function f(x) = x^2 two units to the right would result in the function g(x) = (x2)^2. Similarly, translating f(x) = sin(x) three units upward would give h(x) = sin(x) + 3.
Reflections
Reflections flip the graph of a function across the x-axis or y-axis. A reflection across the x-axis involves multiplying the output variable by
- 1, while a reflection across the y-axis requires multiplying the input variable by
- 1.
For instance, reflecting the function f(x) = x^3 across the x-axis would yield g(x) =(x^3). Reflecting f(x) = cos(x) across the y-axis would result in h(x) = cos(-x).
Dilations
Dilations scale the graph of a function either horizontally or vertically. Horizontal dilations, or stretches along the x-axis, are achieved by multiplying the input variable by a constant. Vertical dilations, or stretches along the y-axis, involve multiplying the output variable by a constant.For
example, dilating the function f(x) = |x| horizontally by a factor of 2 would give g(x) = |2x|. Dilating f(x) = e^x vertically by a factor of 3 would result in h(x) = 3e^x.
Combinations of Transformations
Transformations can be combined to create more complex graphs. For instance, translating the function f(x) = x^2 two units to the right and one unit upward would result in g(x) = (x
- 2)^2 + 1. Reflecting g(x) across the x-axis and dilating it vertically by a factor of 2 would give h(x) =
- 2(x
- 2)^2 + 1.
Algebraic Equations for Transformations
The algebraic equations for performing transformations are as follows:* Horizontal translation: f(xa)
Vertical translation
f(x) + b
-
Reflection across the x-axis
- f(x)
Reflection across the y-axis
f(-x)
Horizontal dilation
f(ax)
Vertical dilation
af(x)
where a and b are constants.
Applications of Functions

Functions are widely used in various fields to model and solve real-world problems. They provide a mathematical framework for representing relationships between variables and can be applied to a diverse range of disciplines.
Science
In science, functions are used to describe physical phenomena, such as the motion of objects, the growth of populations, and the decay of radioactive substances. By formulating mathematical functions, scientists can model and predict the behavior of these systems and make informed decisions based on the results.
Engineering, Functions and their graphs chapter 1
Engineers use functions to design and analyze structures, circuits, and other systems. For example, functions can be used to determine the optimal shape of an aircraft wing to maximize lift or to calculate the flow rate of fluid through a pipe.
Business
In business, functions are used to model economic relationships, such as supply and demand, production costs, and revenue. By understanding these relationships, businesses can make informed decisions about pricing, production levels, and marketing strategies.
Decision-Making and Optimization
Functions are also used in decision-making and optimization problems. By representing the problem as a mathematical function, it is possible to find the optimal solution that maximizes or minimizes a given objective. This approach is used in a wide range of applications, including financial planning, resource allocation, and logistics.
Advanced Topics

Comparing Different Types of Functions
To enhance our understanding of functions, it is essential to compare their properties and graphs. The following table provides a comprehensive comparison of various function types:
| Function Type | Properties | Graph |
|---|---|---|
| Linear | Constant slope; passes through the origin | Straight line |
| Quadratic | Parabolic shape; opens up or down | Parabola |
| Exponential | Increasing or decreasing rapidly; approaches infinity or zero | Exponential curve |
| Logarithmic | Inverse of exponential functions; approaches zero or infinity | Logarithmic curve |
| Trigonometric | Periodic; sine and cosine functions | Sine or cosine waves |
Key Features of Different Function Types
The following table summarizes the key features of different function types:
| Function Type | Domain | Range | Intercepts | Asymptotes |
|---|---|---|---|---|
| Linear | All real numbers | All real numbers | x-intercept:
-b/a; y-intercept c |
None |
| Quadratic | All real numbers | All real numbers | x-intercepts: determined by factoring or quadratic formula; y-intercept: c | None |
| Exponential | All real numbers (for base greater than 1) | Positive real numbers | y-intercept: (0, 1) | x-axis (for base less than 1) |
| Logarithmic | Positive real numbers | All real numbers | x-intercept: (1, 0) | y-axis |
| Trigonometric | All real numbers (for sine and cosine) | [-1, 1] (for sine and cosine) | None | Horizontal: y =
|
Practice Problems
To reinforce your understanding of functions, engage in the following practice problems:
- Graph the linear function f(x) = 2x
5.
- Determine the domain and range of the quadratic function f(x) = x^2
4.
- Find the intercepts and asymptotes of the exponential function f(x) = 3^x.
- Sketch the graph of the logarithmic function f(x) = log2(x).
- Analyze the key features of the trigonometric function f(x) = sin(x).
Essential Questionnaire
What is a function?
A function is a mathematical relation that assigns to each element of a set a unique element of another set.
What is the domain of a function?
The domain of a function is the set of all possible input values for which the function is defined.
What is the range of a function?
The range of a function is the set of all possible output values for the function.